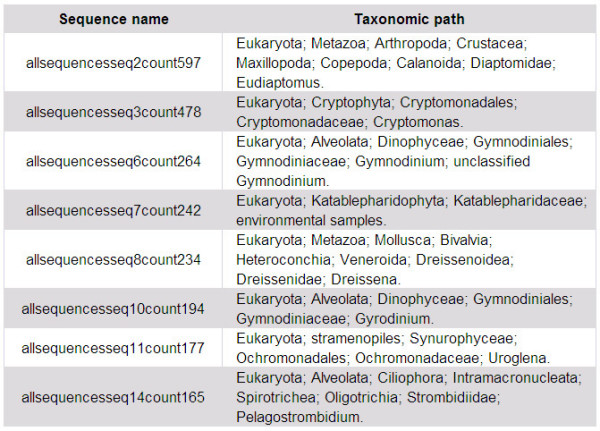
Figure 3.

An example output of taxonomy analysis in CANGS. An example of final output of the Taxonomy Analysis (ta.pl) module. It is a tabular output, the columns from left to right are 1) Query sample non-redundant sequences 2) BLAST percent similarity 3) BLAST e-value 4) Closest NCBI sequence Accession ID 5) NCBI sequence species name and 6) Taxonomic path of the closest NCBI sequence.
