
Figure 1.
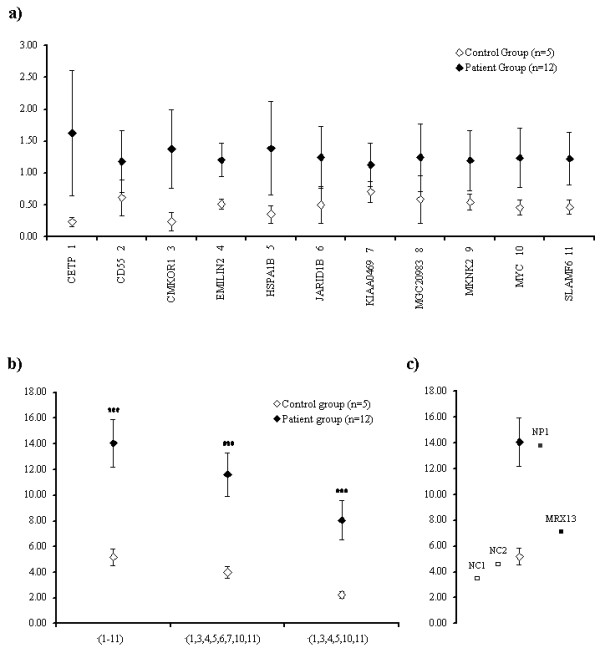
Weighted accumulative permutation analysis for differentiation between groups (WAPDG) results. (a) Means of the 1,000-fold permutated expression values per gene in patients and controls. (b) Results of summarised analysis including different subsets of genes. (c) Results of WAPDG analysis of two novel patients (NP1 and MRX13) and two novel controls (NC1 and NC2). The error bars represent the SD.