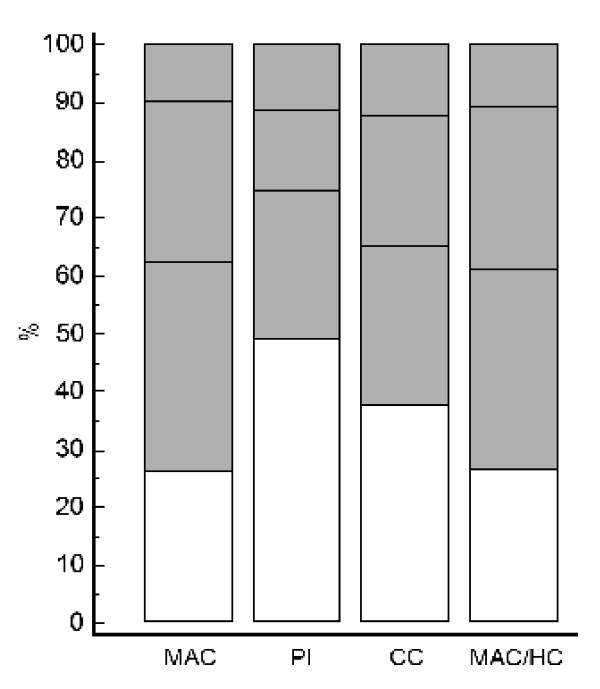
Figure 1.
Proportion of babies with abnormal values in one or more anthropometric indices. Columns stand for all cases with abnormal values (≤ 10th centile for gestational age) in the individual indices. Unfilled areas of columns represent cases with abnormal values of only the indicated index. The three shaded areas of each column represent cases with abnormal values of both the indicated index and of any 1, 2 or 3 additional indices, from bottom to top, respectively. MAC, mid-arm circumference; PI, ponderal index; CC, chest circumference; HC, head circumference

