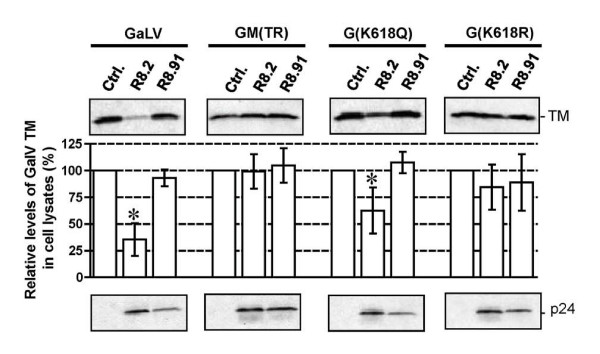
Figure 6.
Western blot and quantitative analysis of GaLV TM levels for wild-type and mutant versions of GaLV Env in the presence of pHR' and either control plasmid pGEM, or plasmids R8.2 or R8.91. Graphs indicate relative levels of GaLV TM compared to the pGEM control, shown as the mean of 3-5 independent experiments. p-values were calculated, and statistical significance (p < 0.05) is indicated by an asterisk. HIV-1 p24 immunological detection was included as control.

