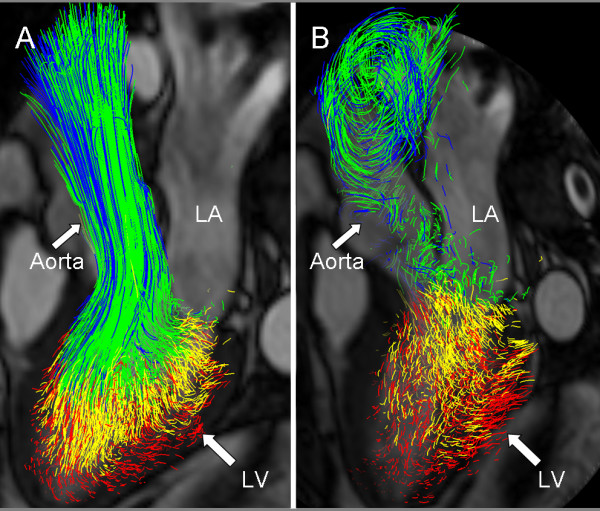
Figure 2.

Systolic blood flow. Pathline visualization of all blood flow involved in one cardiac cycle in the left ventricle of a healthy, 61 year old male at peak systole (A), and at isovolumetric relaxation (B). In all panels a semitransparent three-chamber image provides anatomical orientation. The pathlines are color coded according to: Direct Flow, green; Retained Inflow, yellow; Delayed Ejection Flow, blue; Residual Volume, red. LA, Left Atrium; LV, Left Ventricle.
