Figure 2.
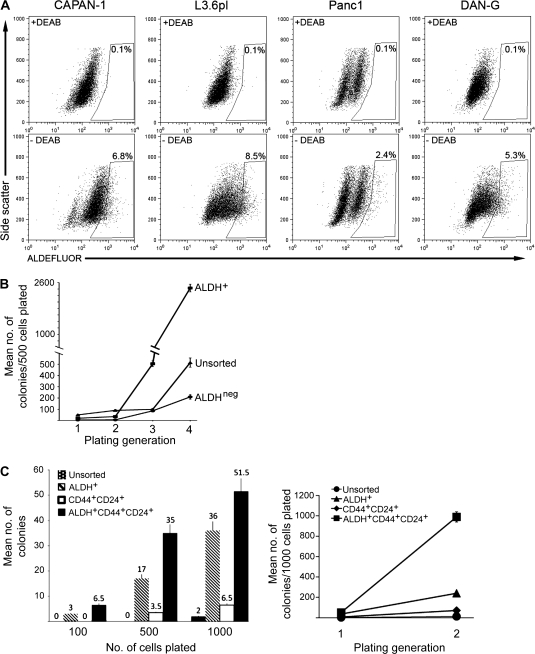
Cancer stem cell properties of aldehyde dehydrogenase (ALDH)–positive pancreatic cancer cells. A) Flow cytometry. ALDH activity in human pancreatic cancer cell lines CAPAN-1, DAN-G, Panc1, and L3.6pl was measured by flow cytometry by using the ALDEFLUOR reagent in the presence (top row) and absence (bottom row) of the ALDH1 inhibitor diethylamino-benzaldehyde (DEAB). The frames represent gates that depict ALDH-positive (ALDH+) cells that were created based on the flow cytometry plot from cells treated with DEAB and then applied to the plots of untreated cells. The percentages of ALDH+ cells are shown in or above the gate. B) Colony formation assay. ALDH+, ALDH-negative (ALDHneg), and unsorted CAPAN-1 cells were isolated by fluorescence-activated cell sorting and evaluated for clonogenic growth in vitro. Five hundred cells were plated in methylcellulose, and colonies were counted 10 days later. Serial replating was carried out for four generations. Error bars correspond to 95% confidence intervals. C) Colony formation assay with serially diluted cells. Unsorted, ALDH+, CD44- and CD24-positive (CD44+CD24+), and ALDH-, CD24-, and CD44-positive (ALDH+CD44+CD24+) CAPAN-1 cells were isolated by fluorescence-activated cell sorting and evaluated for clonogenic growth as described above. The left panel depicts the number of colonies that were counted after varying numbers of cells (100, 500, or 1000) were plated in methylcellulose. The right panel depicts the number of colonies that grew after 1000 cells were plated in methylcellulose and serially replated for a second generation. Mean values (n = 3) with 95% confidence intervals (error bars) are depicted.

