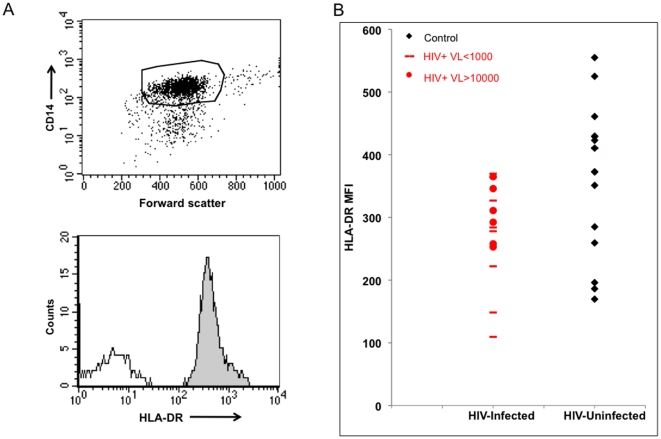
Figure 1. HLA-DR levels on MN from HIV-infected and uninfected individuals.
Purified MN were labeled with anti-CD14 to identify the MN and MFI of HLA-DR. A (upper panel). Representative dot plot of the gating strategy of the single CD14+ population is presented. A (lower panel). Representative histogram of HLA-DR (grey) and isotype control (dotted black) levels. B. HLA-DR levels of control and HIV infected subjects. Black circles for viremic individuals (VL>1000), black dash subjects with VL<1000, and red circles uninfected controls.

