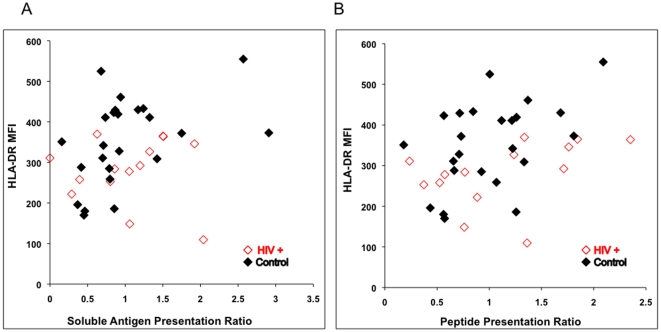
Figure 5. Relationship between HLA-DR level and antigen presentation.
Data from all 38 subjects in the study were normalized. The individual's ratio of presentation was calculated by dividing their IL-2 level for the middle concentration of RT, HEL or peptide by the mean IL-2 level from the control subjects at the same middle concentration of antigen or peptide. Open red diamonds are data from HIV-infected individuals and closed black diamonds for uninfected controls.

