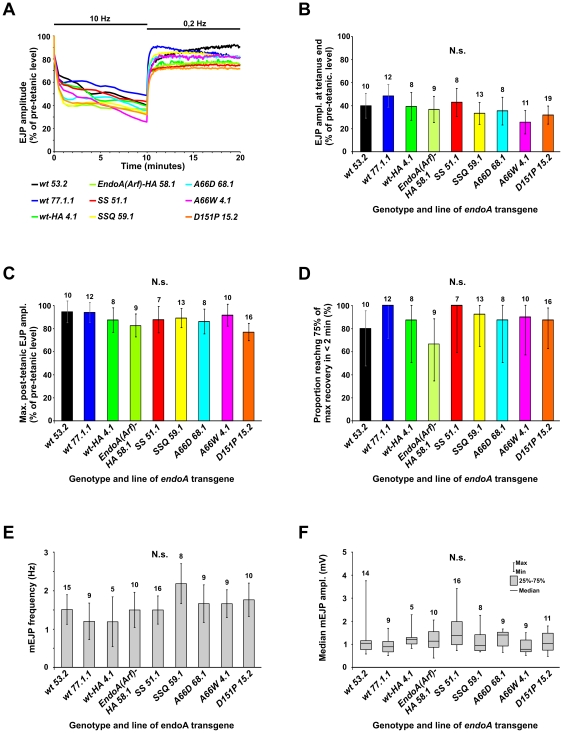
Figure 5. Neurotransmission at the neuromuscular junction in larval mutant rescuants.
Intracellular recordings were made from the somatic muscles of Elav-GAL4/Y or w; UAS-endoA*/+; endoAΔ4/endoAΔ4 third instar larvae, where UAS-endoA* represents a mutated endoA transgene, or one encoding wild type EndoA (“wt”), as indicated in A–F. The suffix “−HA” signifies the presence of an additional HA tag. Raw recordings are not shown. A, Ability to sustain neurotransmitter release during a tetanus (10 min at 10 Hz) and immediately following tetanic stimulation (10 min at 0.2 Hz). The amplitude of the excitatory junctional potential (EJP), relative to the amplitude prior to the tetanus (0.2 Hz, not shown), is plotted. Error bars are omitted in A for clarity; the variability can be judged from B–D. B, The EJP amplitude (mean and 95% confidence interval) at the end of the 10 Hz tetanus, just before switching back to stimulation at 0.2 Hz (arrow in A). C, The maximal EJP amplitude (mean and 95% confidence interval) observed in the 10 min post-tetanic recovery period. D, The proportion of cases, in which the EJP took less than two minutes to recover from the end-tetanic level (arrow in A) to at least 75% of the maximal post-tetanic EJP amplitude, after switching from 10 Hz to 0.2 Hz stimulation. The bars indicate 95% confidence intervals. E and F, Frequency and amplitude of miniature excitatory junctional potentials (mEJPs). For each genotype and line, n is shown above the bars. N.s., not significant.

