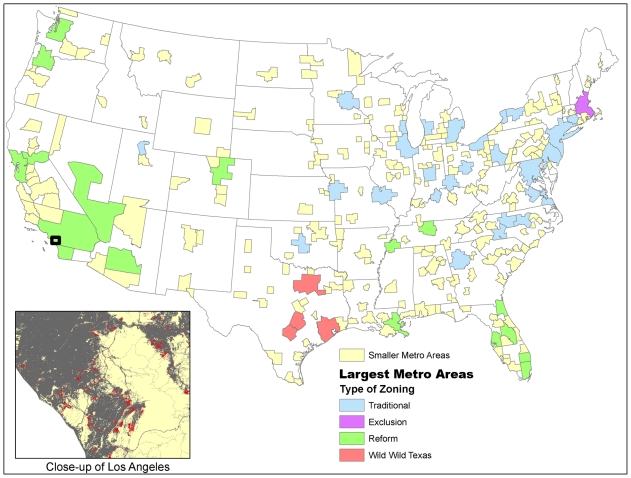
Figure 1. Metropolitan areas examined in this study.
For the largest metropolitan areas, the type of zoning scheme is shown (see text for details). Inset shows land-cover data for the Los Angeles area, with areas built up in 1990 (gray), areas of new development between 1990 and 2000 (red), and open space (beige). For reference, the extent of the inset map is shown on the national map with a black box.

