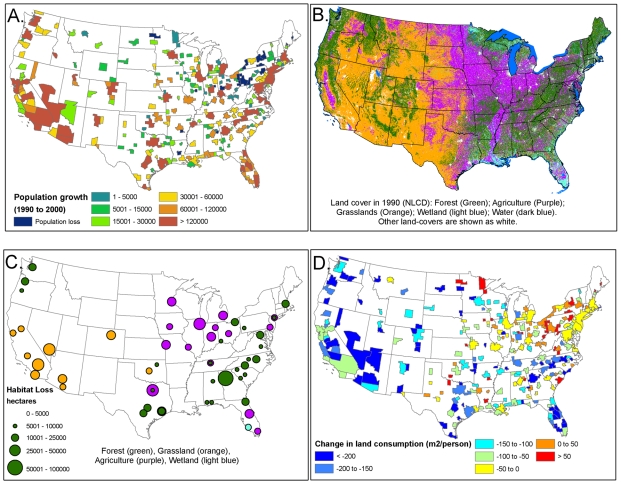
Figure 2. Change in population and land-cover, 1990–2000.
A.) Population growth for each metropolitan area (MSA). B.) Land-cover in 1990. C.) Open space loss within each MSA. The size of the bubble indicates the amount of open space lost, and the color indicates the dominant type of land-cover lost. Cities are only marked when greater than 5000 ha was lost in at least one land-cover category. D.) The change in per-capita land consumption from 1990 to 2000. Cities with negative numbers used less land per-capita in 2000 than in 1990, while cities with positive numbers used more land per-capita.

