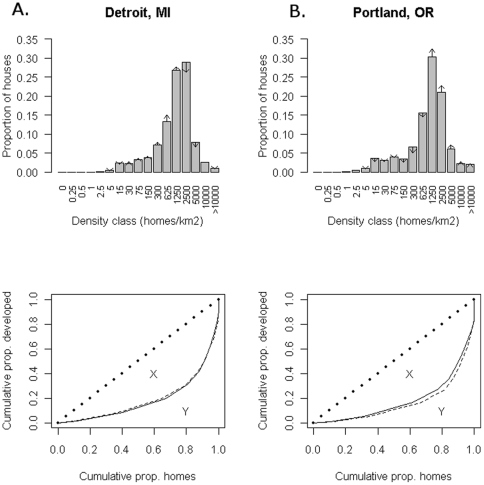
Figure 3. The distribution of household density, 1990–2000.
A.) The proportion of households in neighborhoods of different density categories in 1990 in two cities, Detroit, MI and Portland, OR. Changes in the proportion in each category over the decade are shown by the length of the arrows. For clarity, arrows are only drawn when there is a change of at least 0.5%. For instance, in Detroit almost a third of households are in neighborhoods from 1250–2500 homes/km2, but this proportion is decreasing over time. B.) The cumulative proportion of development versus the cumulative proportion of homes in 1990 (solid line) and 2000 (dashed line). For example, in Detroit the 80% of homes in the highest density neighborhoods consume only 35% of total developed area. For reference, the line of perfect equality is shown (dashed). If all households were in neighborhoods of equal density, the empirical curve would fall along this line of perfect equality. The Gini coefficient is defined as area X divided by the total area under the line of perfect equality (X+Y).

