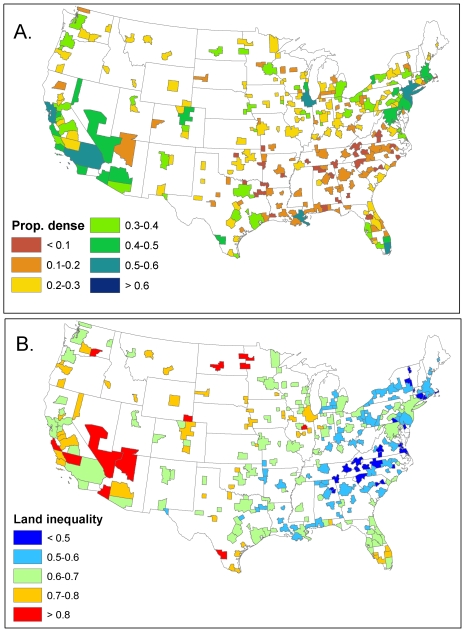
Figure 4. Fine-scale pattern of household density in U.S. cities in 2000.
A.) The proportion of households in neighborhoods that have a density greater than 1250 houses/km2. B.) Land inequality in U.S. cities, as measured by the Gini coefficient, which ranges from 0–1. Higher values indicate greater land inequality.

