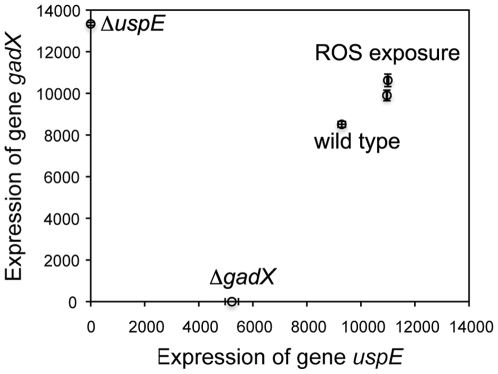
Figure 6. Summary of gadX and uspE gene expression under various experimental conditions.
Plot of the expressions of gadX (x-axis) and uspE (y-axis) against each other in different strain backgrounds and tested experimental conditions. The expression of gadX or uspE was represented by the GFP fluorescence of the reporter strains carrying the respective reporter plasmids pgadX-gfp or puspE-gfp. The strain background or experimental conditions were noted by the data. Expression of gene uspE or gadX was assumed as zero in its single gene mutant ΔuspE or ΔgadX, respectively. Wild type strain was used in the ROS exposure experiments using 1 mM and 10 mM hydrogen peroxide. Error bars indicate standard deviation from replicates.

