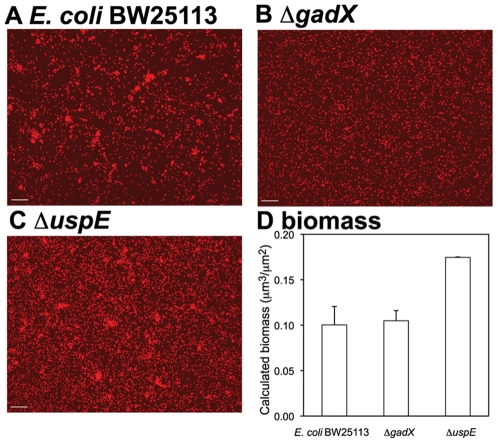
Figure 7. The effect of gadX and uspE on E. coli biofilm formation.
Fluorescent micrograph of biofilms formed by (A) wild type E. coli BW25113, (B) single gene knockout mutant ΔgadX, and (C) single gene knockout mutant ΔuspE. Biomass of biofilms formed by each strain was calculated (D) using the software COMSTAT. Biofilms were formed on glass bottom of 24-well plates for 3 h after inoculation. Suspended cells were gently removed. Biofilms were gently washed with PBS twice and stained with Syto 60 for 10 min before microscopic examination. Images were taken from randomly chosen spots near the center of the well. Error bar in the calculated biomass was standard deviation from three stacks of images. Scale bar = 10 µm.

