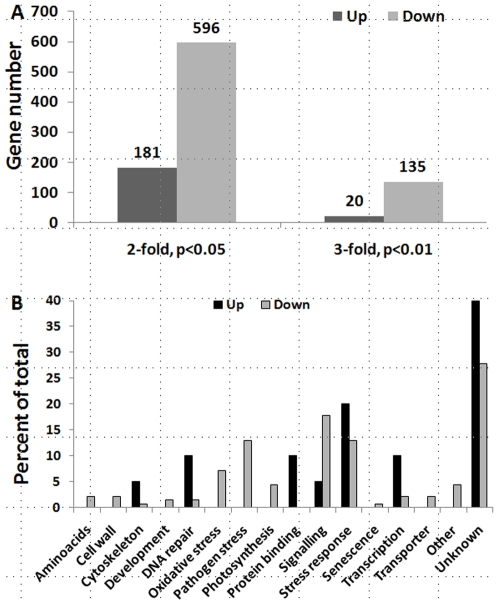
Figure 5. S1_25 plants differ from C1 plants in expression of many genes.
Analysis of gene expression in S1_25 and C1 plants was done using Affymetrix microchips. The data from 3 chips per each experimental group were averaged, and two different cut-offs were performed. One was a 2-fold change and p-value of less than 0.05, and another–a 3-fold change and p-value of less than 0.01. A. Figure shows the number of up- and down-regulated genes belonging to the S1_25 group as compared to the C1 group. The numbers over the top of the bars show the gene number. B. Figure shows the percentile distribution of up- and down-regulated genes belonging to different pathways.

