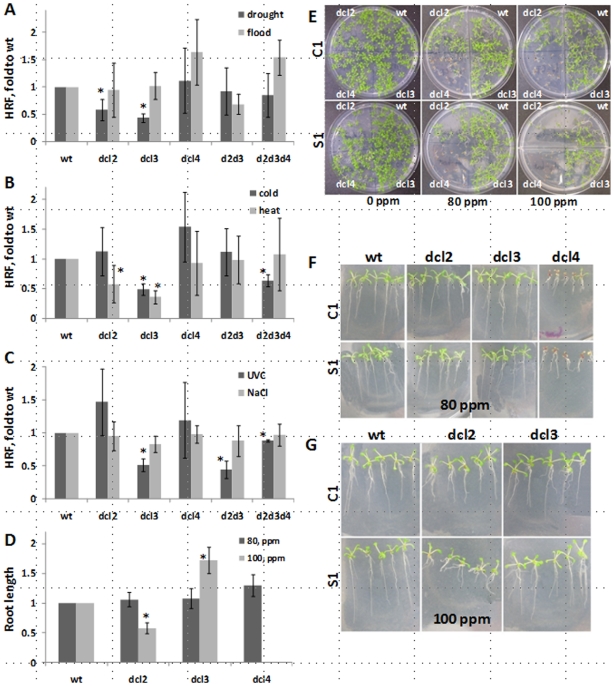
Figure 7. Changes in HRF and stress tolerance in DCL mutants.
A. HRF in the C1 and S1 progeny of the wt, dcl2, dcl3, dcl4, dcl2 dcl3 and dcl2 dcl3 dcl4 plants exposed to drought and flood stress. The ‘Y’ axis shows HRF (the average of 3 experiments and s.e.m.) as fold of S1 to C1, standardized to wt. Asterisks show significant differences in mutants as compared to wt (p<0.05; a single-factor ANOVA). B. HRF in the C1 and S1 progeny of the wt, dcl2, dcl3, dcl4, dcl2 dcl3 and dcl2 dcl3 dcl4 plants exposed to heat and cold stress. The ‘Y’ axis shows HRF (the average of 3 experiments and s.e.m.) as fold of S1 to C1, standardized to wt. C. HRF in the C1 and S1 progeny of the wt, dcl2, dcl3, dcl4, dcl2 dcl3 and dcl2 dcl3 dcl4 plants exposed to UVC and NaCl stress. The ‘Y’ axis shows HRF (the average of 3 experiments and s.e.m.) as fold of S1 to C1, standardized to wt. D. Root length of the C1 and S1 progeny of the heat-treated wt, dcl2, dcl3 and dcl4 plants germinated and grown in the presence of 80 and 100 ppm MMS. Root length was measured in 20 plantlets from each experimental group. The ‘Y’ axis shows a ratio of S1 to C1, standardized to wt. E. Representative Petri plates of the C1 (upper panel) and S1 (lower panel) progeny of the heat-treated wt (top right corner of each plate), dcl2 (top left corner), dcl3 (bottom right corner) and dcl4 (bottom left corner) plants germinated and grown in the presence of 80 and 100 ppm MMS. F. Representative plants of the C1 and S1 progeny of the heat-treated wt, dcl2, dcl3 and dcl4 plants germinated and grown in the presence of 80 ppm MMS. G. Representative plants of the C1 and S1 progeny of the heat-treated wt, dcl2 and dcl3 plants germinated and grown in the presence of 100 ppm MMS.

