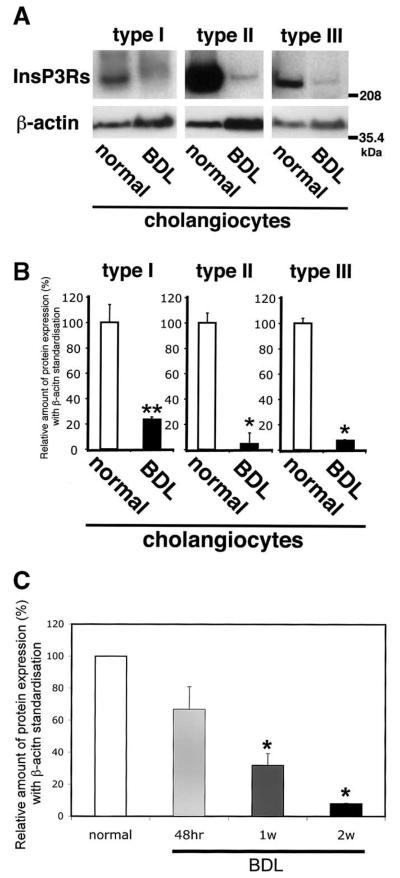
Figure 1.
Expression of each InsP3R isoform decreases after BDL in bile duct epithelia. (A) Western analysis using isoform-specific antibodies. Immunoblot using a polyclonal type I–specific InsP3R antibody identifies a single band in lysates from normal bile duct cells and very weak band in lysates from bile duct cells 2 weeks after BDL. Type II isoform-specific antibody CT2 identifies a strong band in lysates from normal bile duct cells and a weak band in lysates after BDL. A monoclonal type III isoform-specific InsP3R antibody also identifies a strong band in lysates from normal bile duct cells and weak band in lysates after BDL. Data were normalized by β-actin expression determined in the same blots. Amount of protein used was 100 μg in each lane. (B) Densitometric analysis of immunoblots normalized by β-actin expression. The expression of each InsP3 isoform was markedly decreased 2 weeks after BDL. Results are mean ± SEM of 3 independent experiments (*P < 0.01). (C) Type III InsP3R expression decreases progressively over time after BDL. InsP3R expression in cholangiocytes was 63.4% of baseline 48 hours after BDL, a value that was of marginal statistical significance (P = 0.07). InsP3R expression decreased to 27.2% and 7.9% of baseline 1 and 2 weeks after BDL, respectively (*P < 0.01). Results are mean ± SEM of 3 independent experiments.

