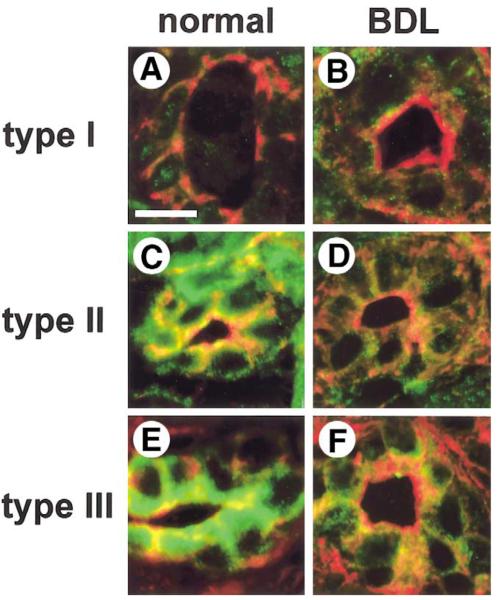
Figure 2.
Subcellular distribution of each InsP3R isoform in bile duct epithelia before and after BDL, as determined by confocal immunofluorescence. Each image is double labeled with an isoform-specific antibody directed against the InsP3R (green), plus rhodamine-phalloidin (red) to identify actin beneath the plasma membrane. (A) A liver section obtained from normal rat liver, labeled with a monoclonal antibody directed against the type I InsP3R. Weak type I InsP3R labeling is seen throughout each bile duct cell. Scale bar, 10 μm. (B) A liver section obtained 2 weeks after BDL, labeled with the same type I InsP3R antibody. This shows that type I InsP3R labeling is nearly absent. (C) Distribution of the type II InsP3R in normal rat bile duct epithelia. Type II InsP3R labeling is seen throughout each cell. (D) Distribution of the type II InsP3R 2 weeks after BDL. Labeling of this isoform now is almost absent from bile duct cells. (E) A section obtained from normal rat liver, labeled with a monoclonal antibody directed against the type III InsP3R. Note that type III InsP3R labeling is concentrated in the apical region. (F) A liver section obtained 2 weeks after BDL. Type III InsP3R labeling now is nearly absent, especially apically.

