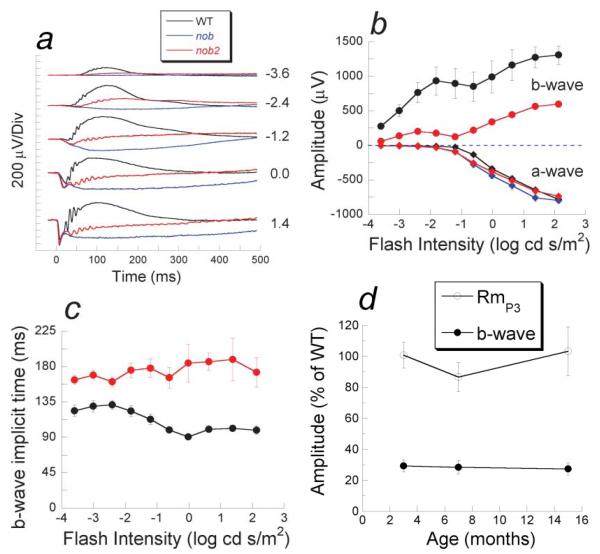
Fig. 2.
Dark-adapted electroretinograms. (a) Comparison of dark-adapted ERGs recorded from nob2 mice (red tracings) with those obtained from WT (black tracings) or nob (blue tracings) mice. Numbers indicate flash intensity in log cd s/m2. (b) Amplitude of the dark-adapted a-wave (diamonds) or b-wave (circles) for nob2 (red), nob (blue), and WT (black) mice. Data points indicate the mean ± S.E.M. response for four mice tested at 6 weeks of age. (c) b-wave implicit times of nob2 (red circles) and WT (black circles) mice. Data points in (b & c) indicate the mean ± S.E.M. response for four nob2 or WT mice, tested at 6 weeks of age. (d) Relative amplitude of a-wave parameter RmP3 (open circles) or b-wave amplitude obtained to a 0.3 log cd s/m2 stimulus (filled circles) plotted as a function of age for nob2 mice relative to the WT mean. Data points in (d) indicate the mean ± S.E.M. Response for 5–7 nob2 mice, which are expressed relative to the mean value obtained from 9–10 WT mice.

