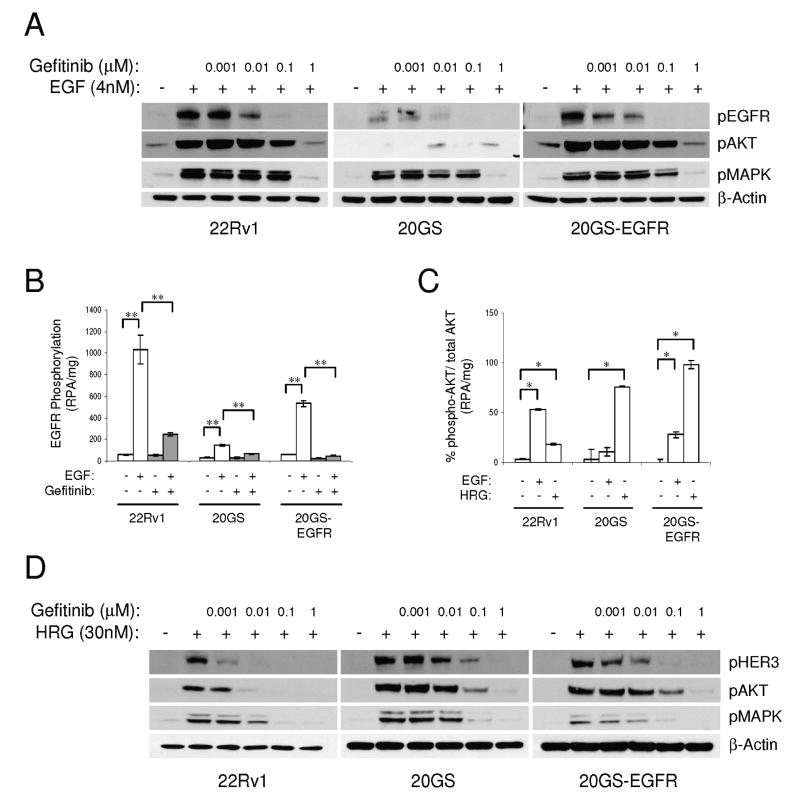
Figure 3.
Phosphorylation responses to ligand stimulation and EGFR-TKI treatment in the 22Rv1 and derivative cell lines. A, Immunoblot analysis of phospho-EGFR, phospho-AKT and phospho-MAPK in response to gefitinib doses prior to stimulation with 4nM EGF. B, EGFR phosphorylation (RPA/mg) in response to 4nM EGF in the absence or presence of 100nM gefitinib using the VeraTag assays. C, VeraTag (RPA/mg) AKT phosphorylation relative to total AKT measurement after stimulation with ligands, EGF or HRGβ1. Significant differences are indicated (* p<0.05, ** p<0.0001). D, Immunoblot analysis of phospho-HER3, phospho-AKT and phospho-MAPK in response to gefitinib doses prior to HRGβ1 stimulation.

