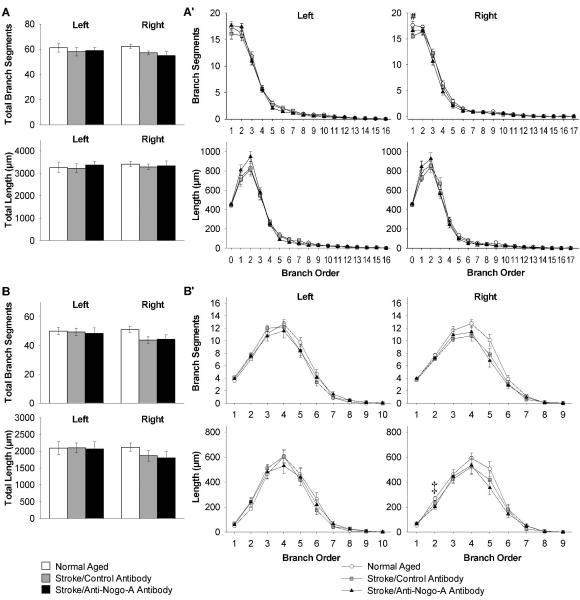
Figure 5.
Decreased dendritic arbor complexity of CA1 pyramidal cells in both stroke groups ipsilateral to the stroke (right). (A) Quantification of apical total number of branch segments and total dendritic length, and (A’) apical branch segments and dendritic length in each branch order. (B) Quantification of basilar total number of branch segments and total dendritic length, and (B’) basilar branch segments and dendritic length in each branch order. Error bars denote ± standard error of the mean. #p<0.05 for normal aged vs. stroke/control antibody (one-way ANOVA p value reported, Student-Newman-Keuls test for post-hoc comparison). ‡p<0.05 for normal aged vs. stroke/anti-Nogo-A antibody (Kruskal Wallis one-way ANOVA on ranks p value reported, Dunn’s method for post-hoc comparison).

