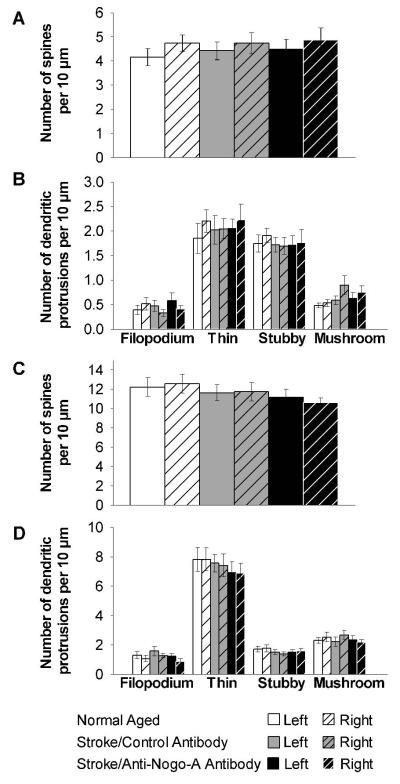
Figure 7.
Apical dendritic spine density and morphology in CA3 and CA1 pyramidal cells did not significantly differ across groups. (A) Quantification of CA3 pyramidal cell dendritic spine density, and (B) CA3 pyramidal cell dendritic protrusion morphology. (C) Quantification of CA1 pyramidal cell dendritic spine density, and (D) CA1 pyramidal cell dendritic protrusion morphology. Error bars denote ± standard error of the mean.

