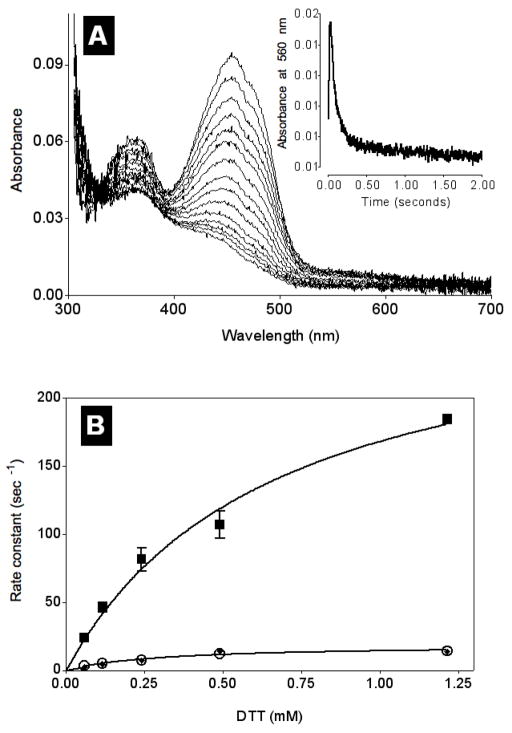
FIGURE 7.
Anaerobic reduction of TbQSOX with DTT. Anaerobic solutions of TbQSOX and DTT (in 50 mM phosphate buffer, pH 7.5, containing 1 mM EDTA, 5 mM glucose, 5 nM glucose oxidase and 1 nM catalase) were mixed in a stopped-flow spectrophotometer at 25 °C to give final concentrations of 8 μM and 0.5 mM respectively. Panel A shows selected spectra from the diode-array detector and the inset follows the absorbance at 560 nm using a monochromator. Panel B plots observed rate constants as a function of the concentration of DTT. Appearance of the long wavelength species at 560 nm shows a limiting rate constant of 280 s−1 with an apparent Kd of 0.66 mM (■). Disappearance of the long wavelength species (◆) and the reduction of flavin (○) show limiting rate constants of 18.8 s−1 and 17.9 s−1 respectively, both with an apparent Kd of 0.31 mM.

