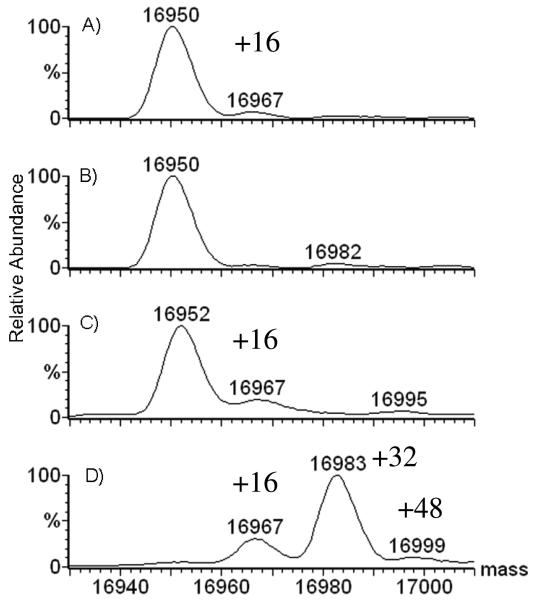
Figure 1.
Mass spectra of 20 μM apomyoglobin (MWtheoretical = 16951) that was: A) frozen, thawed, then incubated at room temperature for 2 h in presence of 500 mM H2O2 prior to catalase treatment, B) incubated at −200 C for 2 h after removal of H2O2 by catalase, C) thawed, and catalase-treated after incubation with 500 mM H2O2 for 2 h at −200 C, D) freeze-dried for 0.5 h to remove the 500 mM H2O2, then resuspended in water for MS analysis.

