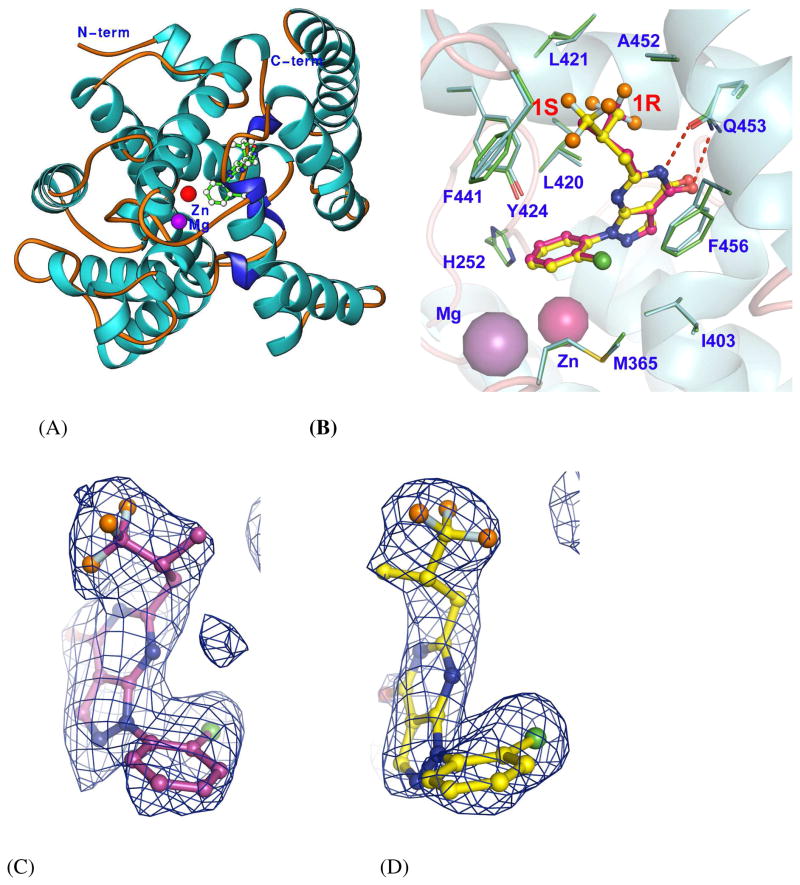
Fig. 2.
Structures of the PDE9A-1 complexes. (A) Ribbon diagram of the PDE9A2 catalytic domain. (B) Superposition of the binding of 1r (yellow bonds) over 1s (pink bonds). The binding residues of PDE9A (green and cyan bonds) have similar conformations. The dotted lines represent the hydrogen bonds between Gln453 and inhibitor 1. The colors for atoms of 1 are: orange for fluorine, green for chlorine, blue for nitrogen, and red for oxygen. (C) and (D) Electron density for 1r and 1s. The (Fo-Fc) maps were calculated from the structures with omission of the inhibitors and contoured at 3 sigmas.

