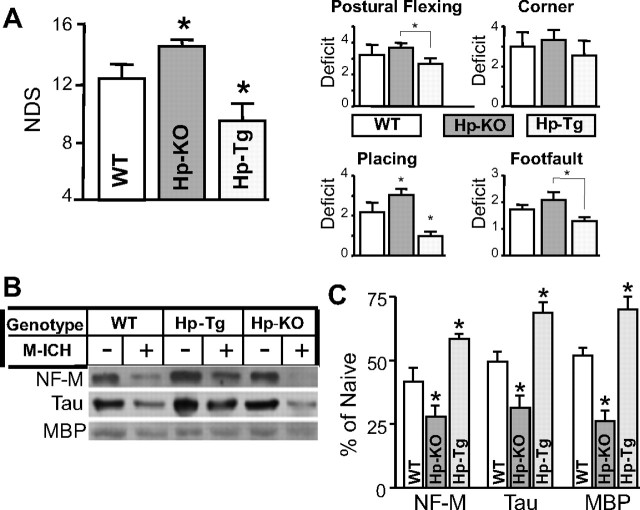
Figure 2.
Hp protects brain from injury produced by M-ICH. A, Bar graph illustrating the composite neurological deficit scores (NDS; left panel) and deficit scores for the individual (postural reflex, corner, right forelimb placing, and right foot fault) tests at 7 d after M-ICH in WT, Hp-KO, and Hp-Tg mice. The data are expressed as mean ± SEM (n = 9). *p ≤ 0.05 from all the remaining groups. B, Photograph of immunoblot showing bands of NF-M, Tau, and MBP in hematoma-affected striatum of WT, Hp-KO, and Hp-Tg mice with (+) and without (−) M-ICH injury at 7 d after the insult. C, Bar graph of densitometrical quantification of NF-M, Tau, and MBP on the immunoblots. The data are calculated as percentage over naive animals and expressed as mean ± SEM (n = 5). *p ≤ 0.05 from all the remaining groups.

