
Figure 3.
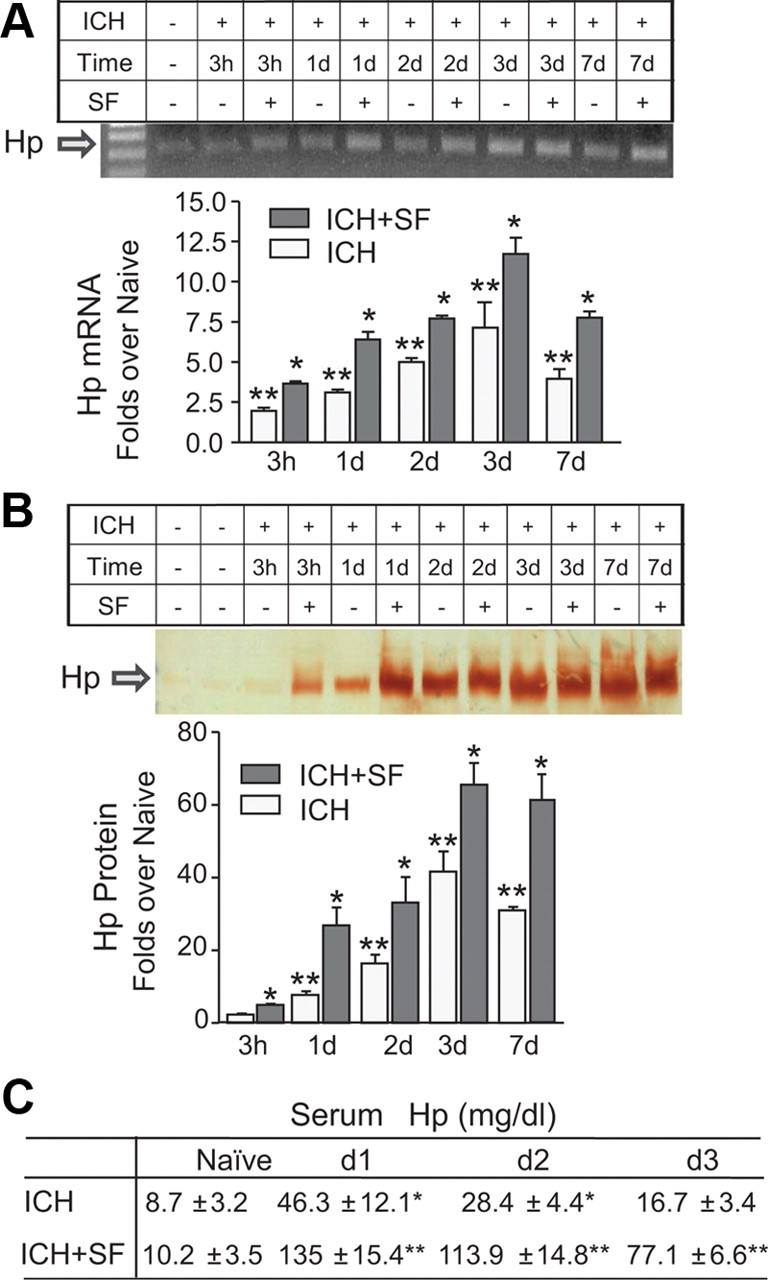
Hp in the hemorrhage-affected striatum is increased after ICH and is augmented by SF. The SD rats were injected intraperitoneally with either saline (ICH) or SF (ICH+SF; 5 mg/kg) at 30 min and 24 h after ICH. A, Photograph of RT-PCR products for Hp on representative agarose gel, and bar graph illustrating the densitometrical quantification of Hp mRNA at 3 h, 1, 2, 3, and 7 d after ICH. The data are calculated as mean ± SEM (n = 4) and expressed as fold increase over the naive groups. *p < 0.05 from naive and the saline control at the same time point; **p < 0.05 from naive. B, Photograph of the representative immunoblot for Hp and bar graph illustrating the densitometrical quantification of Hp protein at 3 h, 1, 2, 3, and 7 d after ICH in rats. The data are calculated as mean ± SEM (n = 4) and expressed as fold increase over the naive groups. *p < 0.05 from naive and ICH control at the same time point; **p < 0.05 from naive. C, Table indicating blood plasma Hp level in naive mice (first column) and in mice with (ICH+SF) and without (ICH) treatment with SF as determined at 1, 2, and 3 d after ICH. The data are expressed as mean ± SEM (n = 5). *p ≤ 0.05 from naive; **p < 0.05 from naive and ICH at the same time point.