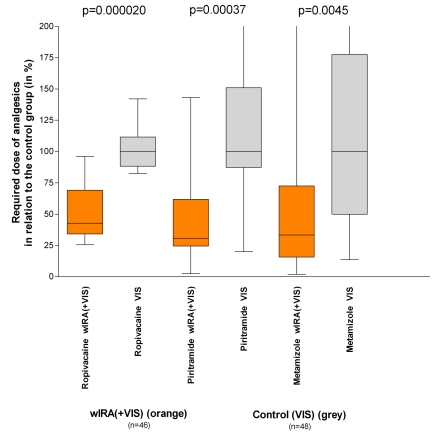
Figure 7. Required dose of analgesics of the subgroups with water-filtered infrared-A (wIRA) and visible light (VIS) in relation to the control subgroups with only visible light (VIS) (medians of the control subgroups = 100) (Study Heidelberg) .
(given as minimum, percentiles of 25, median, percentiles of 75, and maximum (box and whiskers graph with the box representing the interquartile range), adapted from [2], data taken from [19]).
The required dose of analgesics was 52–69% lower (median differences) in the subgroups with wIRA(+VIS) compared to the control subgroups with only VIS.

