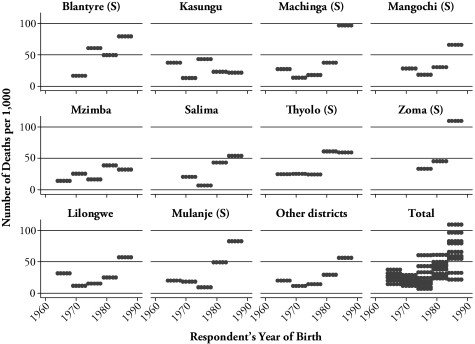
Figure 1.
Trends in Adult Mortality for Respondents Aged 26–30, by Birth Year and District
Notes: (S) denotes that the district is in the Southern region. The graph plots the number of deaths per 1,000. See Ueyama and Yamauchi (2008) for data on mortality probabilities at ages 26–30 by district.

