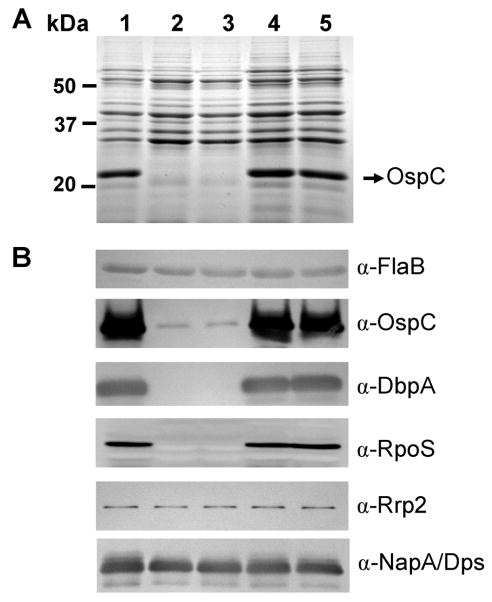
Fig. 5.
BosR controls the expression of OspC and DbpA in Bb. Bb was inoculated into BSK-H medium (pH6.8) at 1000 spirochetes/ml and grown at 37°C. Spirochetes were collected at late-log phase. A volume of whole-cell lysates equivalent to 4 × 10⁷ cells was loaded per gel lane and Bb gene expression was assessed by SDS-PAGE (A) and immunoblot (B) analyses. Approximate molecular masses are indicated at the left in kDa. The arrow in (A) indicates the position of OspC in SDS-PAGE. Specific antibodies, indicated as α-, used in the immunoblot (B) are indicated on the right. Lane 1, WT B31; lane 2, bosR- OY10/D12; lane 3, mutant OY10/H3; lane 4, bosR-/+ OY34/E6; lane 5, bosR-/+ OY34/C4.

