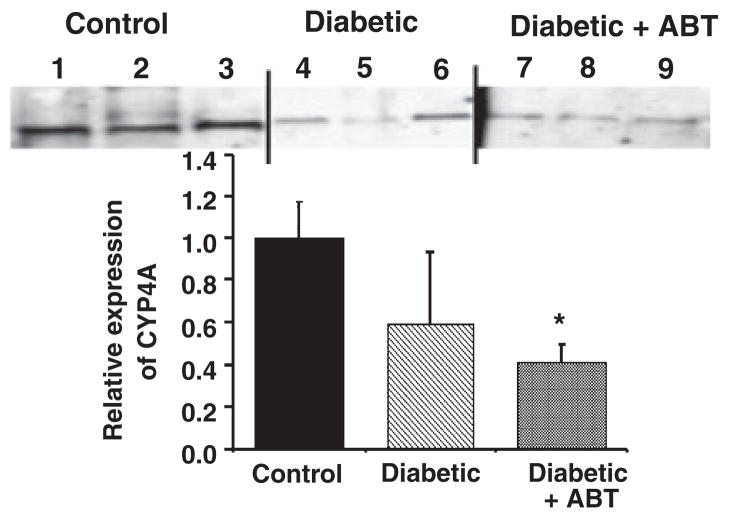
Figure 8.
Comparison of the expression of Cytochrome P4504A protein in homogenates prepared from the renal artery of control, diabetic, and diabetic rats chronically treated with ABT. The data are expressed as relative to mean intensity recorded in renal arteries obtained from the control animals. Each lane was loaded with 20 μg protein prepared from the renal of individual rats. *Significant difference compared to the level of expression in the control group.

