Figure 3.
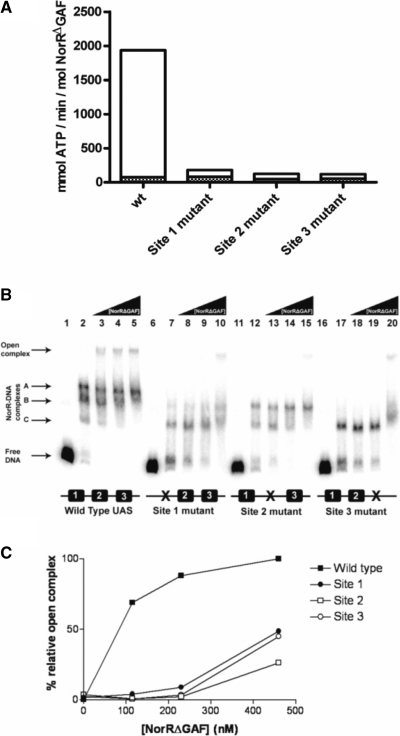
ATPase and open complex stimulating activities of NorRΔGAF associated with wild type and mutant promoter DNA constructs. (A) Rates of ATP hydrolysis by NorRΔGAF were monitored at 340 nm for 20 min at 37°C (filled bars) after which 5 nM of the wild type norR-norVW fragment was added, and the rates were monitored for a further 20 min at 37°C (empty bars). ATPase activities of NorRΔGAF in the presence of DNA constructs carrying a mutant NorR-binding site were compared with the wild type construct. ATPase activities are expressed as specific activity relative to protein concentration in mmol ATP min−1 mol NorR−1. The bar representation is a sum of the values obtained without and with DNA. (B) Each open complex assay reaction contained 1 nM of a 32P-labelled DNA fragment encoding either the wild type or mutant norR-norVW intergenic region. All lanes contained the components required for open complex formation except lanes 1, 6, 11 and 16, which contained DNA only and lanes 2, 7, 12 and 17, which contained 115 nM NorRΔGAF but lacked σ54. NorRΔGAF concentrations were 115 nM (lanes 3, 8 13, 18), 230 nM (lanes 4, 9, 14, 19) and 460 nM (lanes 5, 10, 15, 20). Free DNA, NorRΔGAF/DNA and open complexes are indicated by the arrows to the left of the figure. (C) Heparin resistant open complex species were quantified using a Fujix BAS 1000 phosphorimager. Bands were quantified by their intensity relative to the open complex band formed with the wild type DNA construct at 460 nM NorRΔGAF, which was assumed to be 100%.

