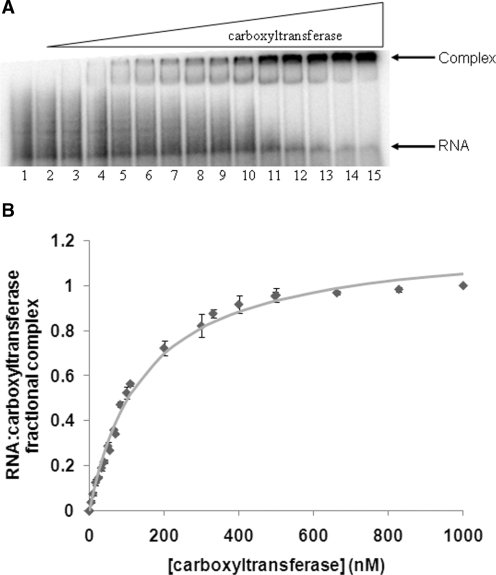
Figure 3.
(A) Electrophoretic analysis of the transcript from CT α-subunit titrated with CT. (A) All lanes contain 50 fmol 32P-labeled mRNA, while lanes 2–15 contain 1.0, 5.0, 10, 25, 40, 55, 70, 85, 100, 200, 300, 400, 500 and 600 nM CT. (B) Binding isotherm for CT binding to the transcript from CT α-subunit. The points represent averages from triplicate measurements. The error bars shown are the standard deviation. The curve represents the best fit of the data to Equation 1. No conclusions about the stoichiometry of binding can be made from this curve.

