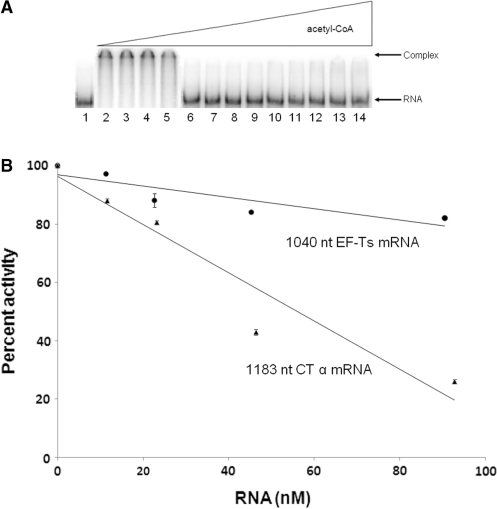
Figure 6.
(A) Electrophoretic analysis of the transcript from CT β-subunit titrated with CT. All lanes contain 50 fmol 32P-labeled mRNA, lane 1 contains only mRNA, while lanes 2–14 contain 166 nM CT and acetyl-CoA at 0, 20, 50, 100, 200, 300, 400, 500, 600, 750, 1000, 2000 and 4000 µM. (B) RNA inhibition of CT activity. Circles represent averages from triplicate measurements for reactions containing the 1040 nt EF-Ts transcript at 0, 11.3, 22.6, 45.3 and 90.6 nM. Triangles represent averages from triplicate measurements for reactions containing the 1183 nt CT α transcript at 0, 11.6, 23.2, 46.4 and 92.8 nM. The error bars shown are the standard deviation. Note that enzymatic reactions contain only 1 mM KCl, conditions under which the affinity of CT for RNA is higher than that determined from EMSA assays.

