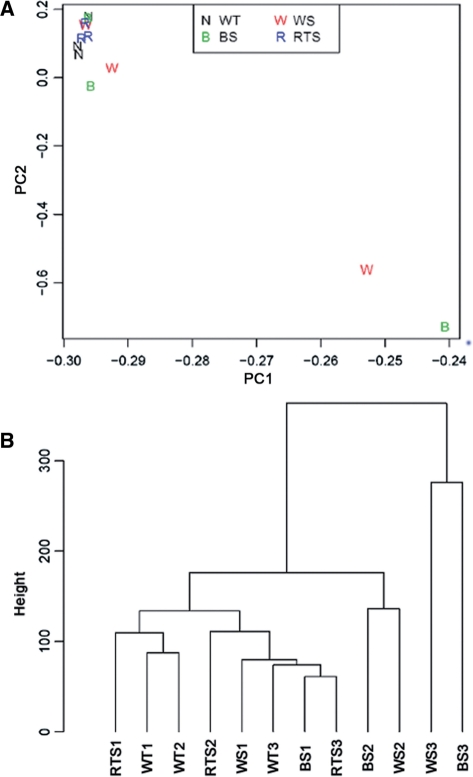
Figure 1.
Multivariate analyses of gene expression data. (A) Principle component analyses. Two-dimensional visualization of samples by the first two principal components (PC1 and PC2). (B) Average linkage clustering of samples by Euclidean distance. The vertical axis (Height) indicates the similarity between the clusters.

