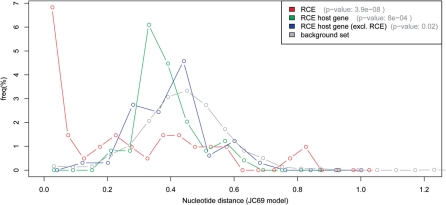
Figure 3.
Nucleotide distance of 4D sites. Histogram of nucleotide distances of RCE 4D sites (red line), RCE host gene 4D sites (green line), RCE host gene excluding the RCE (blue line), and the 4D sites from 1000 randomly selected human:mouse orthologous gene pairs (grey line). The P-value in the legend represents the significant difference level between the corresponding set and the random background set.

