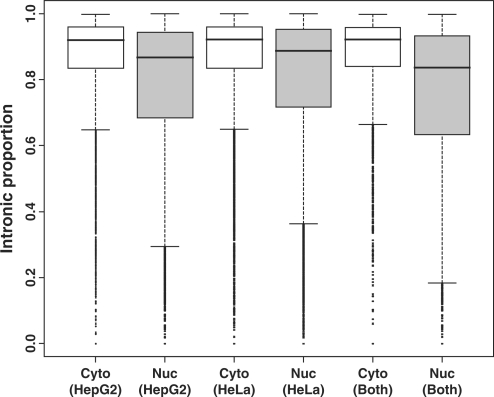
Figure 2.
The intronic proportions of cytosolic and nuclear isoforms. The intronic proportion was calculated as [intronic region (in bp)]/[intronic region (in bp) + exonic region (in bp)]. Note that the cytosolic isoforms have larger intronic proportions. The boxplots are for the transcripts enriched in the cytosol or the nucleus of HepG2, HeLa or both cell lines.

