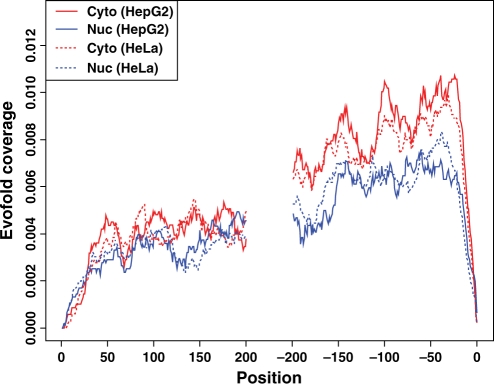
Figure 3.
The average functional RNA fold-coverage for the cytosolic and nuclear isoforms. For every site in a mature mRNA, x was defined as the position relative to the nearest terminal. It is positive for distances from the 5′ terminal and negative for distances from the 3′ terminal [excluding poly(A)]. The y-axis is the average RNA fold-coverage at each position for the cytosolic isoforms of HepG2 (red solid line), the nuclear isoforms of HepG2 (blue solid line), the cytosolic isoforms of HeLa (red dashed line), and the nuclear isoforms of HeLa (blue dashed line).

