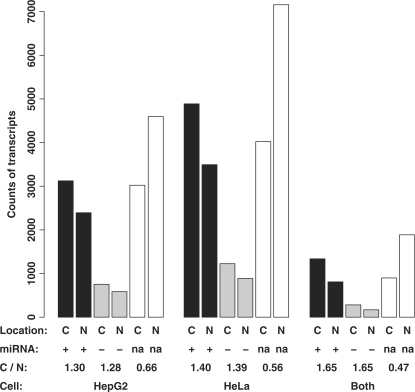
Figure 4.
The expression of miRNAs does not significantly impact their target isoforms’ nucleocytosolic locations. The y-axis is the counts of the transcripts. The cytosolic isoforms (C) and the nuclear isoforms (N) of individual cell lines or both cell lines were considered. They were further divided into the transcript isoforms with at least one target site of an expressed miRNA (+, black bars), the transcript isoforms with target site(s) of non-expressed miRNA(s) (−, grey bars), and the transcript isoforms without any miRNA target site (na, white bars). The ratios of the cytosolic isoform counts to the nuclear isoform counts (C/N) are listed. Note that the C/N ratios are not significantly different between the (+) and (−) groups.

