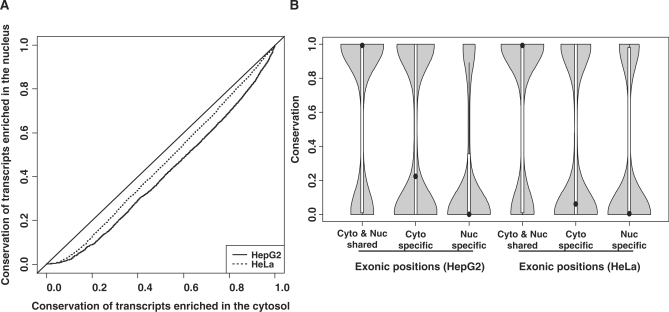
Figure 5.
The conservation scores and nucleocytosolic locations. (A) A quantile–quantile plot for the conservation scores of the cytosolic isoforms (x-axis) and those of the nuclear isoforms (y-axis). The average PhastCons score across every exonic position of a transcript isoform was used to represent the conservation level of that transcript. (B) The violin plots of the conservation scores for the exonic sites specific to the cytosol or nucleus or the exonic sites shared by the cytosolic and nuclear isoforms. Only the genes having both the cytosolic and nuclear isoforms were considered. A violin plot is similar to a boxplot except that it adds the kernel density plot of the data.

