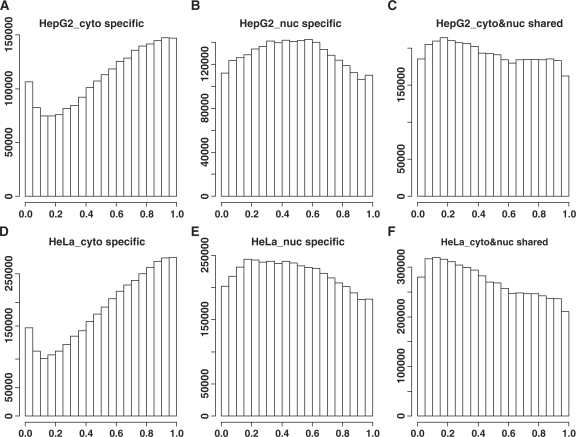
Figure 6.
The relative positions of the exonic sites. Only the genes having both cytosolic and nuclear isoforms were considered. The non-redundant exonic sites from the different transcript isoforms of the same gene were pooled together and sorted according to their genomic coordinates (from 5′–3′). The relative position of the i-th exonic site was calculated as (i − 1)/(n − 1) where n is the total number of non-redundant exonic sites. The y-axis represents the counts of exonic sites with a specific relative position. (A) and (D) are for the exonic sites specific to the cytosol. (B) and (E) are for the exonic sites specific to the nucleus. (C) and (F) are for the exonic sites shared by the nuclear and cytosolic transcripts. (A), (B) and (C) are for the HepG2 cell line and (D), (E) and (F) are for the HeLa cell line.

