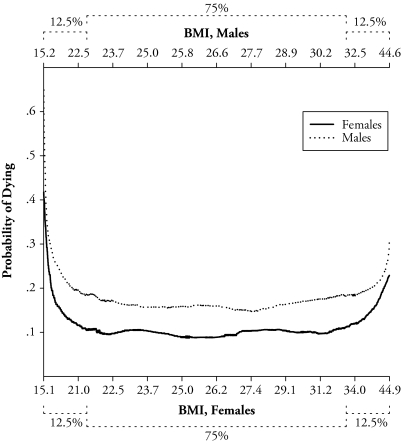
Figure 2.
Probability of Dying Versus Percentiles of the BMI Distribution by Sex, 1931–1941 HRS Cohort: 1992–2004
Notes: Adapted from Figure 1, except with x-axis proportional to the BMI distribution of the samples. Dotted brackets indicate percentage of the sample.

