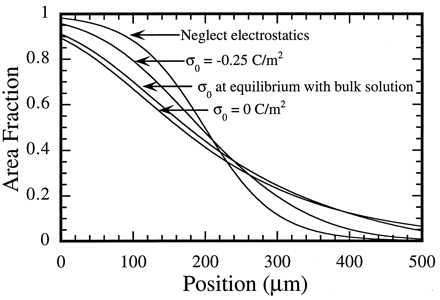
Figure 2.

Calculated concentration profiles illustrating the effect of lateral electrostatic interactions within the membrane. Three distributions of substrate charge, σ0, are shown together with the case where electrostatic interactions between molecules are neglected. These curves were generated for a binary mixture of equally sized molecules where one carries a net charge of −1. There is a barrier at the zero position, and this is the anode side of the region. The net force per molecule is 8.9 × 10⁻¹⁷ N, which is comparable to forces realized experimentally. All profiles were normalized to contain the same amount of lipid.
