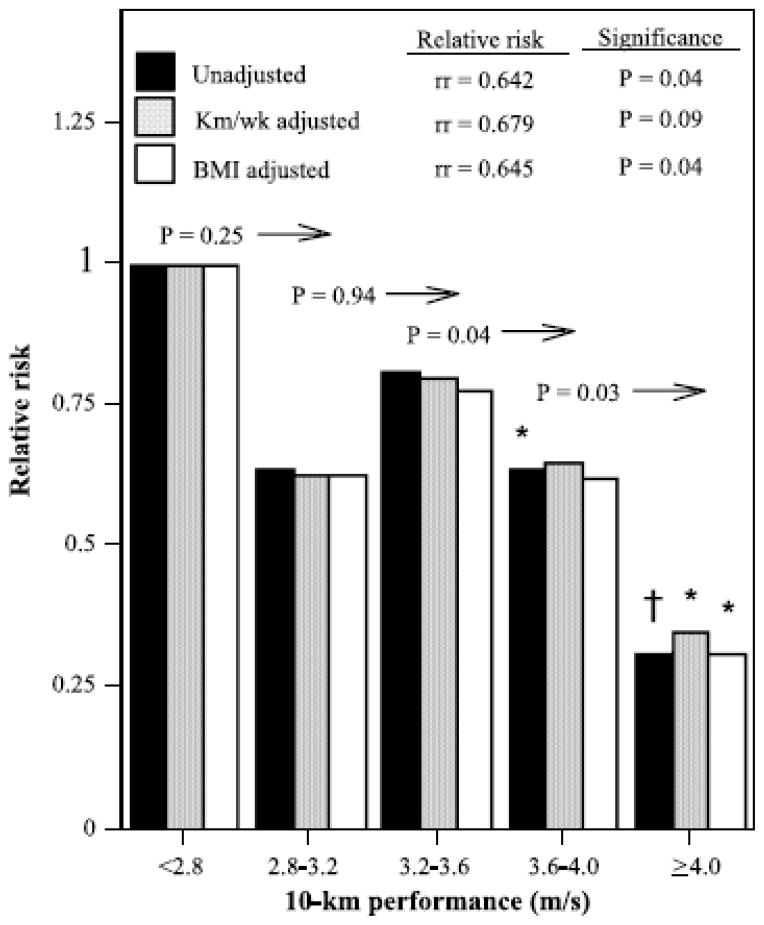
FIGURE 2.
Relative risk of self-reported physician-diagnosed diverticular disease by cardiorespiratory fitness (10-km race performance time) relative to the least-fit (slowest) runners, adjusted for age, sex, pack-years of cigarette consumption, and intake of meat, fish, fruit, and alcohol. Additional adjustment for usual running distance (km/d) and BMI where indicated. Significance levels relative to the least fit runners are coded: *P < 0.05, †P < 0.01. Significance levels relative to all faster men are presented above the bars and to the left of the arrows (e.g., men who ran faster than 3.6 m/s were significantly less likely to report physician-diagnosed diverticular disease than those who ran 3.2–3.6 m/s, P = 0.04). Relative risks (rr) per meter-per-second increment in the 10-km performance (as a continuous variable) are presented at the top.

