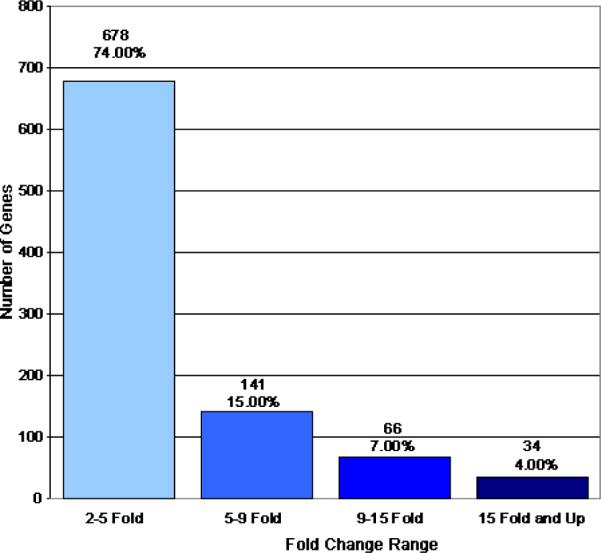
Figure 2.

Genes decreased 2 fold or greater between cataract and clear lenses. This figure graphically represents the genes whose expression levels are decreased by 2 fold or greater in cataract relative to clear lenses. The total number of genes included in each fold change category are indicated. Percentages indicate the total number of genes in each category relative to the total number of decreased genes (919) on the chip.
