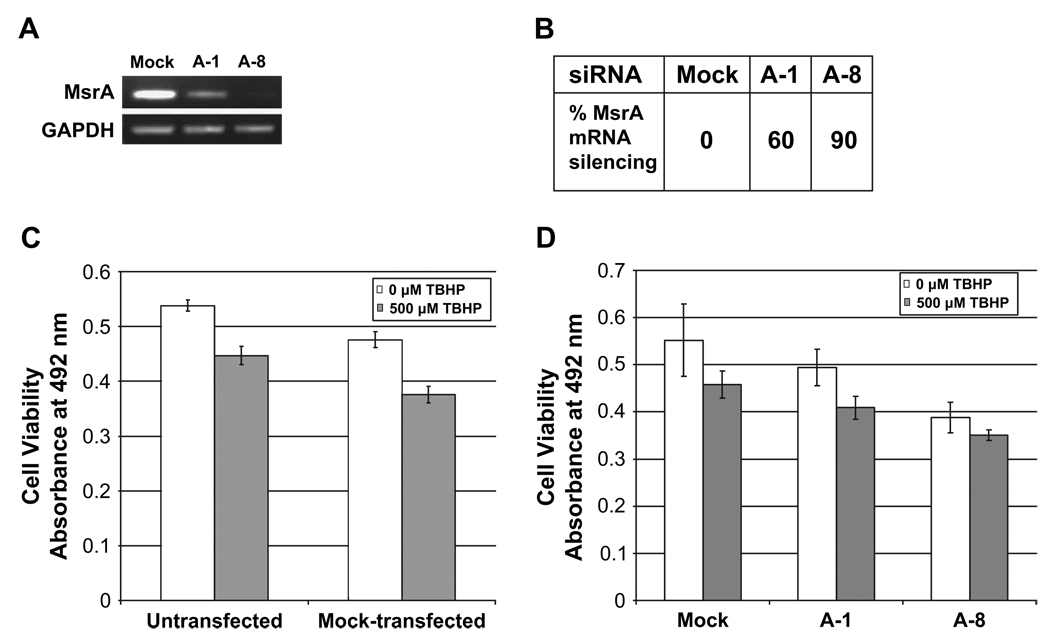
Fig. 1.
Viability of HLE cells treated with MsrA-specific siRNAs under normal and oxidative stress conditions. (A) Ethidium-bromide stained gel showing the levels of MsrA-specific gene suppression at 48 h post-transfection with indicated siRNAs relative to mock-transfected cells. (B) Relative percent of MsrA transcript levels in mock and siRNA-transfected cells determined by densitometry. (C) Representative graph of cell viability measured by MTS assay 48 h between untransfected and mock-transfected cells exposed to 0 µm (white bars) or 500 µm (gray bars) TBHP. Error bars represent standard deviations for three separate assays. (D) Representative graph of cell viability measured by MTS assay 48 h between mock-transfected and siRNA-transfected cells using indicated siRNAs treated with 0 µm (white bars) or 500 µm (gray bars) TBHP. Error bars represent standard deviations for three separate assays.

