An official website of the United States government
Here's how you know
Official websites use .gov
A
.gov website belongs to an official
government organization in the United States.
Secure .gov websites use HTTPS
A lock (
) or https:// means you've safely
connected to the .gov website. Share sensitive
information only on official, secure websites.

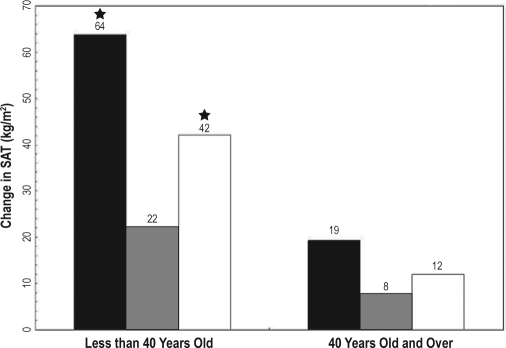
 6 to 7 h, □ ≥ 8 h; SAT (subcutaneous adipose tissue); (★) Indicates significant difference from 6 to 7 h (P > 0.01). Model adjusted for age, gender, center/race, baseline fat, and age.