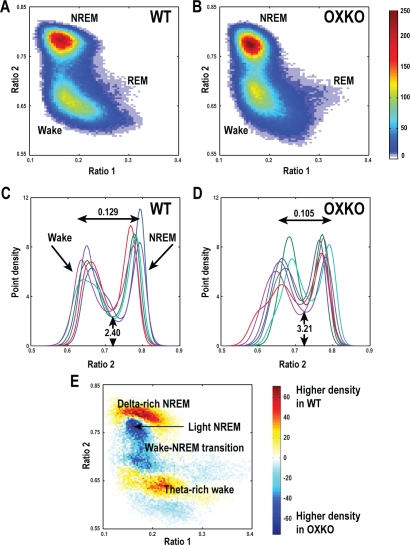
Figure 2.
OXKO mice have abnormal distributions of EEG activity during wake and sleep.
A, B—Point densities were averaged across mice of each genotype to create average WT and OXKO mouse density plots. WT mice (n = 6) have a Wake cluster that includes a region corresponding to active wakefulness with higher theta activity (high ratio 1), a highly concentrated NREM sleep cluster, and a relatively sparse REM sleep cluster, reflecting much less time spent in REM sleep compared to other states. In contrast, OXKO mice (n = 7) have a smaller Wake cluster concentrated closer to the transition region between Wake and NREM sleep. The color scale represents point densities with warm colors indicating higher densities.
C, D—State space densities for individual WT and OXKO mice projected into the ratio 2 dimension. Each color represents data for an individual mouse. The projection yields 2 peaks: the left peak is associated with Wake and the right peak is associated with NREM sleep. The horizontal peak-to-peak distances are shorter in OXKO mice (one-way ANOVA, P < 0.05). Trough height is higher in OXKO mice, reflecting more time spent in the transition region between Wake and NREM sleep (one-way ANOVA, P < 0.01).
E—Difference plot showing the average density pattern of OXKO mice subtracted from that of WT mice. Here the color scale highlights differences between genotypes: warm colors indicate regions where the average density is greater in WT mice, and cool colors indicate higher density in OXKO mice. WT mice spend more time in deep (delta-rich) NREM sleep and active (theta-rich) Wake, whereas OXKO mice spend more time in light NREM sleep and the Wake/NREM sleep transition region.

