Figure 3.
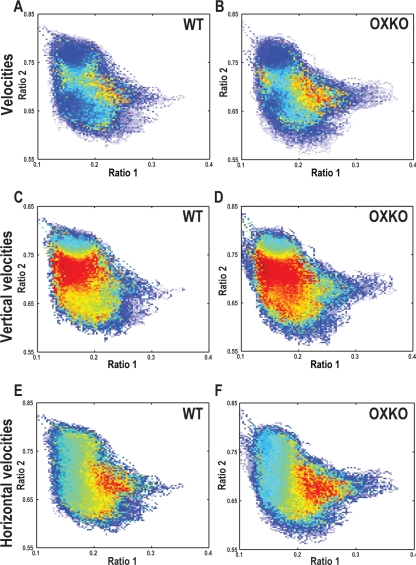
OXKO mice have faster movements in certain regions of the state space. Plot colors represent the directionless (A, B), vertical (C, D), or horizontal (E, F) velocities of EEG activity originating in that region of the state space. Different color maps were used for each pair of panels to emphasize differences between genotypes.
A, B—Average directionless velocity plots in WT and OXKO mice distinguish between stable states where velocities are slow (cool colors) and transition regions where velocities are fast (warm colors).
C, D—The vertical (ratio 2) components of velocity vectors highlight the fast transitions between Wake and NREM sleep. In OXKO mice, this region of fast vertical velocities extends far into the middle of the Wake cluster.
E, F—The horizontal (ratio 1) components of the velocity vectors highlight the fast transitions between Wake and the REM sleep/Cataplexy clusters. For both horizontal and vertical velocities, the regions of fast transitions are larger in OXKO mice (one-way ANOVA, P < 0.01). This shows that regions of sleep/wake behavior that are normally stable are susceptible to rapid changes in OXKO mice, possibly contributing to the frequent state transitions in these animals.

